Analysis of Acoustic Attenuation Spectra Due to Ion Transport Processes in Glassy Electrolytes
1 Department of Physics,
2 Department of Fundamental
Engineering,
3
Department of Ceramic, Glass and Cement,
Received zzz, revised zzz, accepted zzz
Published online zzz
PACS 43.35.Fj, 61.43.Fs, 66.30.Dn, 72.80
An acoustic attenuation spectroscopy as a powerful technique is used to study the relaxation processes in phosphate glasses containing Cu+ conductive ions of the system CuI-CuBr-Cu2O-P2O5 with respect to ion transport mechanisms. The acoustic attenuation spectra exhibit several distinctive peaks, corresponding to transport mechanisms originating from the different kinds of sites responsible for ionic hopping. The experimental results of acoustic spectra are then analysed in connection with the frequency response, the activation energy at spectra peaks and the peak intensities using theoretical models and suitable mathematical procedure for the simulations to fit the experimental data.
© 2004 WILEY-VCH Verlag GmbH & Co. KGaA, Weinheim
1 Introduction It is known that the investigation of acoustic spectra of ionic glasses (glassy electrolytes) can reflect the basic features of the relaxation and transport mechanisms of the mobile ions. Acoustical measurements made over a wide range of frequencies and temperatures can characterize different relaxation processes according to corresponding transport mechanisms due to a strong acousto- ionic interaction [1-3]. In glassy electrolytes, the mobile ions encounter different kinds of sites so that ionic hopping motion and relaxation processes connected with charge mobility can be obviously explained by modified jump relaxation model and suitable response function for transport mechanisms and relaxation processes description, respectively [3,4].
In this contribution we present experimental results obtained by acoustic investigation of the set of glasses prepared in the system CuI-CuBr-Cu2O-P2O5 and their theoretical description with the purpose to study ion transport mechanisms in these ion conductive glasses and to find the role of cuprous halides producing Cu+ ions. An analysis of the acoustical spectra using various theoretical models for the simulations with application of genetic algorithm was provided to fit the experimental data.
2 Experimental and results The procedure of glass preparation in the system CuI-CuBr-Cu2O-P2O5 has been already described [5]. The set of glasses was originally prepared to investigate the role of cuprous halides producing Cu+ ion keeping their ratio to the glass forming system (Cu2O-P2O5 ) constant. The compositions of the complex set of glass samples are summarized in Tab. 1.
The acoustical attenuation was measured using longitudinal acoustic wave of frequency 13, 18 and 27 MHz in the temperature range 140-380 K [6]. The temperature and frequency dependencies of electrical conductivity (dc and ac in the frequency range 50 Hz - 1 MHz) were also measured in the same temperature range as acoustical measurements [7]. The acoustic attenuation of the most ofinvestigated glasses is plotted as a function of temperature at the constant frequency n= 18 MHz in Fig. 1. The
________________
*1 Corresponding author: e-mail: bury@fel.utc.sk
Table 1 Starting glass compositions (in mol.%)of prepared glasses.
|
Glass |
Composition (in mol.%) |
|||
|
Sample |
CuI |
CuBr |
Cu2O |
P2O5 |
|
BIDP1 |
15.91 |
2.27 |
54.55 |
27.27 |
|
BIDP2 |
13.63 |
4.55 |
54.55 |
27.27 |
|
BIDP3 |
11.36 |
6.82 |
54.55 |
27.27 |
|
BIDP5 |
9.09 |
9.09 |
54.55 |
27.27 |
|
BIDP6 |
6.82 |
11.36 |
54.55 |
27.27 |
|
BIDP7 |
4.55 |
13.63 |
54.55 |
27.27 |
|
BIDP8 |
2.27 |
15.91 |
54.55 |
27.27 |
|
BDP |
0 |
18.18 |
54.55 |
27.27 |
measurements indicate in all samples one broad attenuation peak at higher temperature, in which we can distinguish at least two separated peaks. Another peak was detected at lower temperatures as a part of broader peak.
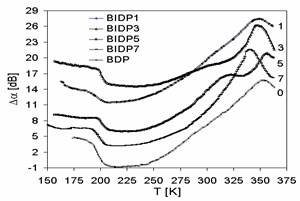 Fig. 1 Acoustic attenuation spectra of investigated ion conductive glasses of
the system CuI-CuBr-Cu2O-P2O5 for different
glass composition. The individual spectra are shifted for better resolution.
Fig. 1 Acoustic attenuation spectra of investigated ion conductive glasses of
the system CuI-CuBr-Cu2O-P2O5 for different
glass composition. The individual spectra are shifted for better resolution.
The ion transport properties of these investigated solid electrolytes were also reflected in the electrical conductivity spectra [6,7]. The temperature dependence of dc conductivity indicates four different transport mechanisms with activation energies Ea1, Ea2, Ea3 and Ea4 including also some association and dissociation processes (Ea2, Ea3)connected with some defects formation [7,8]. All prepared glasses have high ionic conductivity at room temperatures of the order 10-3 S m-1. The frequency dependencies of ac conductivity measured at various temperatures (conductivity spectra) exhibit one slope of brakes at higher frequencies and lower temperatures characterizing the transition from dc conductivity to dispersive conductivity indicating thus the transition between two transport hopping processes [2,7]. Additional jumps from one value of ac conductivity to another characterizing the transition between the similar ion transports but between two kinds of anions was observed at lower frequencies and higher temperatures .
The infrared study confirmed mainly ![]() phosphate anion groups
and also some lower-condensed anions
phosphate anion groups
and also some lower-condensed anions ![]() and
and ![]() in small amounts. The cuprous halides as well as their
mixtures do not affect significantly the dominant phosphate oxide structural
units of glasses.
in small amounts. The cuprous halides as well as their
mixtures do not affect significantly the dominant phosphate oxide structural
units of glasses.
3 Theoretical analysis
of attenuation processes The ion transport properties and the
formal theories of relaxation processes
of many ion conducting glasses, melts and crystals are similar [2]. In the case
of systems containing a low concentration of mobile ions the attenuation may be
described as a superposition of Debye-like, single relaxation time processes in
which the individual ion hops occur independently of each other [5]. In fact all the investigated
relaxation peaks are much broader than Debye peak that can be interpreted as
arising from the existence of a distribution of relaxation times due to random
deviations in the local arrangement of the system. According to this hypothesis
when the relaxation losses are not too large one can write for the acoustic
attenuation a distribution f(t) of
relaxation times [3]. As a consequence, the t distribution can be connected with a
distribution of activation energies f(E),
representing the heights of the barriers that the ions must surmount to
go into the near allowed positions. The acoustic attenuation will exhibit a maximum when the relaxation time
tis comparable to the period (1/w) of the acoustic perturbation, where ![]() is the most probable relaxation time. The relaxation processes described
by this Arrhenius equation are characterized by activation energy
is the most probable relaxation time. The relaxation processes described
by this Arrhenius equation are characterized by activation energy![]() for
jumps over the barrier between two potential minima and typical values for preexponential
factor 1/t0 = n0 » 1013–1014 s-1.
Here
for
jumps over the barrier between two potential minima and typical values for preexponential
factor 1/t0 = n0 » 1013–1014 s-1.
Here ![]() is the temperature of peak maximum and kB is the Boltzman constant.
is the temperature of peak maximum and kB is the Boltzman constant.
This approach depends on the assumption that ion migration may be treated in terms of a set of non-interacting Debye-like processes. However, in solid electrolytes the mobile ion concentrations are large and conduction mechanisms are thought to be cooperative. The relaxation phenomena observed in a wide variety of materials exhibit a double power-law type of frequency dependence, the relationship to Debye behaviour can be then expressed in the form [3]
|
|
|
(1) |

where m and n are power-law exponents, which take values between 0 and 1. When m = 1 and n = 1, equation (1) reduces to the equation for a single Debye-like process. Another function that can be used to fit acoustic attenuation spectra, is the Kohlrausch-Wiliems-Wats function [9]. The acoustic attenuation spectrum of the investigated cuprous halide glasses can be then fitted using these theoretical attenuation functions and mathematical procedure using the genetic algorithm with binary representation of the theoretical attenuation function variables [10] in connection with the visual construction of the acoustic attenuation model. During the fitting procedure the Debye function, Double Power Law function and modified Double Power Law function were gradually used [11].
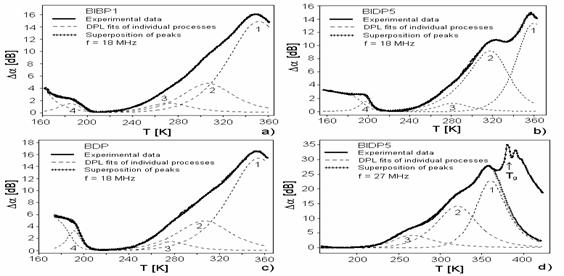 Fig. 2 Acoustics spectra (full lines) of samples BIDP1 (a), BIDP5 (b)
and BDP (c) measured at 18 MHz and BIDP5 measured at 27 MHz (d). Cross-markedline represents
best fit as superposition of individual peaks (dashed lines).
Fig. 2 Acoustics spectra (full lines) of samples BIDP1 (a), BIDP5 (b)
and BDP (c) measured at 18 MHz and BIDP5 measured at 27 MHz (d). Cross-markedline represents
best fit as superposition of individual peaks (dashed lines).
The representative acoustic spectra and their theoretical simulations are illustrated in Fig. 2 (a-c). Using the theoretical model with double power-law function, the calculated lines gave an excellent agreement with measured spectrum in whole temperature range. The temperature dependences of acoustic attenuation were then analyzed assuming the existence of four thermally activated relaxation processes of Cu+ ions in connection with different kinds of sites. In spite of the infrared study suggesting only one dominant anion group two strong peaks in acoustic spectra (denoted as 1 and 2 in Fig. 2) were observed at temperatures bellow the transition temperature. The proportion of these peak intensities depends on the glass composition, namely on the ratio CuI/CuBr (mixing cation effect) and changes from value 3.7 through minimum value 1.3 again to value 3.5 at samples BIDP1, BIDP5 and BDP, respectively. The results of acoustic investigation and the shape of both Arrhenius plots of dc conductivity and conductivity spectra indicate some processes connected with association and/or dissociation of new defects. In these processes the oxygen vacancies can be introduced into the system by some reactions associated with an electron representing then centers for Cu+ ions. Another two peaks that can be connected with lower-condensed anions are not affected by halides ratio significantly. Using the values of Tpeak for individual peaks and Eq. (1), the activation energies were determined (Tab. 2). Activation energies calculated from Arrhenius plots of dc conductivity are also summarized in Tab. 2, for comparison.
Comparing the acoustic and electrical measurements, some of the individual transport mechanisms indicated by acoustical spectra can correspond to the mechanisms indicated by electrical measurement, but some can be different because of both different microscopic mechanisms for relaxation processes and the temperature dependence of preexponential factor n0 [6].
Table 2 Activation energies calculated from Arrhenius plots of dc conductivity and acoustic spectra.
|
Glass Sample |
Electrical measurements |
Acoustical measurements |
|||||||||||||
|
|
|
|
|
|
|
|
|
|
|||||||
|
BIDP1 |
0.46 |
0.52 |
0.30 |
0.40 |
0.47 |
0.41 |
0.37 |
0.25 |
|
||||||
|
BIDP2 |
0.44 |
0.54 |
0.41 |
0.44 |
0.46 |
0.41 |
0.36 |
0.27 |
|
||||||
|
BIDP3 |
0.46 |
0.58 |
0.30 |
0.42 |
0.46 |
0.41 |
0.37 |
0.26 |
|
||||||
|
BIDP5 |
0.44 |
0.54 |
0.32 |
0.42 |
0.46 |
0.42 |
0.33 |
0.26 |
|
||||||
|
BIDP6 |
0.39 |
0.52 |
0.35 |
0.43 |
0.46 |
0.42 |
0.35 |
0.28 |
|
||||||
|
BIDP7 |
0.41 |
0.50 |
0.23 |
0.43 |
0.45 |
0.42 |
0.39 |
0.25 |
|
||||||
|
BIDP8 |
0.42 |
0.52 |
0.26 |
0.41 |
0.46 |
0.43 |
0.36 |
0.27 |
|
||||||
|
BDP |
0.40 |
0.51 |
0.15 |
0.38 |
0.47 |
0.43 |
0.39 |
0.26 |
|
||||||
5 Conclusions The experimental investigation of ion conductive glasses in system CuI-CuBr-Cu2-P2O5 proved that acoustical spectroscopy in like manner as electrical conductivity spectroscopy can be very useful technique for transport mechanisms study and it seems also even to be verysensitive and can then distinguish between individual transport mechanisms.
Theoretical analysis using double power law function and suitable mathematical model gave the excellent fit of experimental spectra and several different kinds of sites responsible for ionic hopping motion were discovered. The influence of chemical composition on ion transport mechanisms was exhibited and frequency response, peak intensity and activation energy of spectra peaks were observed.
Further experimental study and theoretical analysis of experimental measurements including both new samples and new spectroscopic techniques should be done for better understanding of ion transport and relaxation mechanisms in this type of conductive glasses.
Acknowledgements The authors would like to thank Mr. F. Černobila for technical assistance. This work was partly financially supported by Grant 1/9141/02 of the Ministry of Education of the Slovak Republic.
References
[1] E. V. Charnaza, B. F. Borisov, A. A. Kuleshov: Proc. World Congress on Ultrasonics, Berlin (1995) 483.
[2] B. Roling, A. Happe, M. D. Ingram and K. Funke: J. Phys. Chem. B 103 (1999) 4122.
[3] D. P. Almond, A. R. West: Solid State Ionics 26 (1988) 265.
[4] K. Funke: Solid State Ionics 94 (1997) 27-33.
[5] P. Znášik, M. Jamnický: J. Mat Science Letter 14 (1995) 766.
[6] P. Bury, P. Hockicko, M. Jamnický and I. Jamnický: Advances in EEE, 2, No. 3- 4 (2003) 16.
[7] P. Bury, P. Hockicko, M. Jamnický and I. Jamnický: Proc. of the 18th International Congress on Acoustics, Kyoto 2004, Vol. II, 1137.
[8] P. Knauth, H. L. Tuller: J. Am. Ceram. Soc., 85 [7] (2002) 1654-80.
[9] B. Roling and M. D. Ingram: Physical Review B 57 (1998) 14192.
[10] D. E. Goldberg: Genetic Algorithms in Search, Optimization and Machine Learning. Addisom-Wesley, 1989.
[11] P. Hockicko, P. Bury, M. Jamnický and I. Jamnický: Advances in EEE, 3, No. 2 (2004) 243.