ON THE RELATION BETWEEN ELECTRICAL AND ACOUSTICAL PROPERTIES OF ION CONDUCTIVE GLASSES
O VZŤAHU MEDZI ELEKTRICKÝMI A AKUSTICKÝMI VLASTNOSŤAMI SKIEL S IÓNOVOU VODIVOSŤOU
P. Bury 1), P. Hockicko 1), M. Jamnický 2), I. Jamnický 1)
1) Department of Physics, University of Žilina, 010 26 Žilina, Slovakia
2) Department of Ceramic, Glass and Cement, Slovak Technical University, 812 37 Bratislava, Slovakia
Summary The technological interest in fast ionic conductivity in glassy materials is increased in last years for various solid state electrochemical devices such as solid-state batteries, electrochronic displays, and sensors. The ion conductive glasses have several advantages comparing with crystalline materials because of their easy preparation, their stability, the large available composition ranges and reasonable cost.It is known that the investigation of conductivity spectra of ionic glasses can reflect the basic features of the relaxation and transport mechanisms of the mobile ions and the high ion conductivity at room temperature is the most important criterion which should be meet the fast ion conductive glasses. However, the relaxation and transport mechanisms can be investigated also by acoustic methods, that can have some advantages comparing to electrical ones as the high sensitivity, absence of contact phenomena and so on.
In the contribution we present some electrical and acoustical properties of glasses prepared in the system CuI-CuBr-Cu2O-(P2O5+MoO3). The main purpose of the contribution is to contribute to the investigation of ion transport mechanisms in these fast ion conductive glasses and to determine the relation between electrical and acoustical properties considering the various glass compositions. The both electrical and acoustical measurements are also utilized to the study of relaxation processes occurring in these glasses and to the ion activation energies determination.
Abstrakt V posledných rokoch je zvýšený technologický záujem o sklenené materiály s vysokou hodnotou iónovej vodivosti a to pre rôzne tuhé elektrochemické súčiastky, ako sú tuhé batérie, elektrochronické displeje a senzory. Sklá s iónovou vodivosťou majú v porovnaní s kryštalickými materiálmi niekoľko výhod vyplývajúcich z ich ľahkej prípravy, ich stability, veľkého rozsahu možného zloženia a primeranej ceny. Je známe, že skúmanie vodivostných spektier iónových skiel môže odrážať základné rysy relaxačných a transportných mechanizmov pohyblivých iónov a že vysoká iónová vodivosť pri izbovej teplote je najdôležitejším kritériom, ktoré by mali spĺňať sklá s iónovou vodivosťou. Avšak relaxačné transportné mechanizmy môžu byť skúmané aj akustickými metódami, ktoré v porovnaní s elektrickými môžu mať určité výhody, ako je vysoká citlivosť, nepodstatná úloha kontaktov a pod..
V tomto príspevku predkladáme niektoré elektrické a akustické vlastnosti skiel pripravených v sústave zloženia CuI-CuBr-Cu2O-(P2O5+MoO3). Hlavným cieľom príspevku je vyšetriť mechanizmy transportu iónov v týchto sklách s výraznou iónovou vodivosťou a určiť súvis medzi elektrickými a akustickými vlastnosťami pri uvážení ich rôzneho zloženia. Tak elektrické ako i akustické merania sa využívajú súčasne k štúdiu relaxačných procesov v sklách a k určeniu aktivačných energií iónov.
1. INTRODUCTION
Characterization of transport mechanisms in glassy materials with substantial fast ionic conduction is extremely important since the ion transport significantly affects their practical performace. The ion conductive glasses, called also glassy electrolytes play an important role in a number of modern electrochemical devices, such as solid-state batteries, electrochronic displays, and sensors [1-3]. A considerable attention is given in experimental study also because of fundamental interest in their ion transport mechanisms that are less well understood then in crystalline materials in spite of the fact that transport mechanisms in glasses with fast ion conductivity are permanently investigated over last twenty years.
The advantage of glassy materials over crystalline fast ion conductors include absence of boundaries, isotropic conduction properties wide compositional flexibility, easy fabrication and reasonable cost. Solid electrolytes present also numerous potential advantages over liquid electrolytes, including absence of liquid containment and leakage problems, ability to perahe with more highly reactive electrodes over a wider temperature range and the possibility for miniaturization using thin films processing techniques.
The ion transport properties of many ion conducting glasses, melts and crystals are similar [4]. The most important criterion, which should be met by the fast ion conductive glasses, is the high ion conductivity at room temperature [5,6]. The ion transport properties of conductors are directly reflected in the electrical conductivity spectra [7,8]. However, the transport mechanisms investigated by acoustical methods can have some advantages compared to the electrical ones as high sensitivity, absence of contact phenomena and so on [9-12]. Acoustical measurements made over a wide range of frequencies and temperatures can characterise different relaxation processes according to corresponding transport mechanisms due to a strong acousto-ionic interaction.
The concept of relaxation processes is shown to provide a general basis for understanding both spectra in terms of the ion dynamics. In glassy electrolytes, the mobile ions encounter different kinds of site and ionic hopping motion and relaxation processes connected with charge mobility so that jump relaxation model has to be modified accordingly [7].
Cu+ conductive ions have similar electronic configuration and smaller ionic radii in comparison with Ag+ conductive ions. The conductivity of glasses is affected not only by the type of conductive ions, but also strongly depends on „glass forming“ oxide. Phosphate glasses containing Cu+ conducting ions are good ionic conductors with room temperature conductivity of the order 10-3 W-1cm-1. The highest conductivity has been recorded in systems containing large fractions of cuprous halides, such as CuI or CuBr [13,14]. Moreover, if two different kinds of halide anions are mixed into cation conducting glasses, a positive deviation of the electrical conductivity from the additivity rule can be observed (mixed anioneffect) [13].
In this contribution we present experimental results of acoustical and electrical investigation of two sets of glasses prepared in the system CuI-CuBr-Cu2O-(P2O5+MoO3) with purpose to study ion transport mechanisms in these fast ion conductive glasses and to find both the role of glass forming system and the role of cuprous halides producing Cu+ ions. The relation between acoustical and electrical properties considering the various glass compositions was determined, too.
2. EXPERIMENTAL PROCEDURE
2.1. Glass Preparation
Glasses in the system CuI-CuBr-Cu2O-(P2O5+MoO3) were prepared from commercial reagents (Fluka) according to previously described procedures [13]. Batches of 15 g were melted under a dry argon atmosphere to avoid the oxidation of Cu+ during melting and mixed in appropriate portion (see Tab. 1 and Tab. 2) in silica ampoule at 933 K for 90 min. The glass melts were rapidly quenched by pressing them between two brass plates to a final thickness of » 1-2 mm. The resulting discs of 20 mm in diameter were kept between the plates until their temperature decreased to room temperature. Losses in weight during melting were < 1 %. To check the reproducibility of the results, all glasses were prepared three times. Two systems of glasses were prepared to investigate both the role of glass-forming system and the role of cuprous halides produced additionalCu+ ions keeping their totalratio 60 mol. % to 40 mol. %.
Table 1. Starting compositions (in mol.%) of glasses prepared in the System I.
|
Glass |
Composition (in mol.%) |
|
|
|
|
||||
|
sample |
CuI |
CuBr |
Cu2O |
P2O5 |
MoO3 |
||||
|
IP |
25.000 |
- |
56.250 |
18.750 |
- |
||||
|
IPM |
25.000 |
- |
46.875 |
9.375 |
18.750 |
||||
|
BPM |
- |
25.000 |
46.875 |
9.375 |
18.750 |
||||
|
IM |
25.000 |
- |
37.500 |
- |
37.500 |
||||
|
|
|
|
|
|
|
|
|
|
|
Table 2. Starting compositions (in mol.%) of glasses prepared in the System II.
|
Glass |
Composition (in mol.%) |
|
|
|
|
|||
|
sample |
CuI |
CuBr |
Cu2O |
P2O5 |
MoO3 |
|||
|
IBPM 2 |
21.875 |
3.125 |
46.875 |
9.375 |
18.750 |
|||
|
IBPM 3 |
18.750 |
6.250 |
46.875 |
9.375 |
18.750 |
|||
|
IBPM 5 |
15.625 |
9.375 |
46.875 |
9.375 |
18.750 |
|||
|
IBPM 1 |
12.500 |
12.500 |
46.875 |
9.375 |
18.750 |
|||
|
IBPM 4 |
6.250 |
18.750 |
46.875 |
9.375 |
18.750 |
|||
|
|
|
|
|
|
|
|
|
|
2.2. Electrical Measurements
The temperature and frequency dependencies of electrical conductivity (dc and ac in the frequency range from 50 Hz up to 1 MHz) were measured using FLUKE PM 6306 impedance analyser in the temperature range of 140-380 K. The measured complex impedance allowed us to obtain the bulk dc and ac conductivity of glass samples by means of the usual impedance analysis. Gold electrodes were sputtered on to the samples surfaces for electrical investigation.
2.3. Acoustical Experiments
The acoustical attenuation was measured using MATEC attenuation comparator for longitudinal acoustic wave of frequency 13, 18 and 27 MHz generated by quartz transducer in the same temperature range as electrical measurements. The quartz buffer was used to separate the signal from quite short sample (Fig. 1).
However, for the acoustical attenuation measurements only three samples with thickness » 2 mm (shaded in Tab. 1 and Tab. 2) were chosen. The samples for acoustical attenuation measurements were cylindrical in shape (area » 1 cm2, thickness » 2 mm) and end-faces were polished to be flat and parallel.
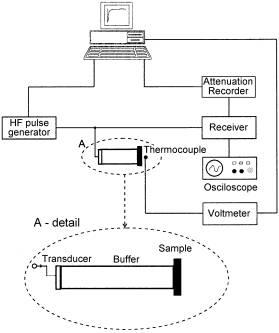
Fig. 1. Experimental arrangement for acoustic attenuation measurement.
3. RESULTS AND DISCUSSION
3.1. Dc conductivity
The representative results of measured d.c. conductivity (sample IBPM2) as a function of temperature are illustrated in Fig. 2. As all of the temperature dependence of dc glass conductivity can be fitted by the equation
s= s0exp(-Ea/kT), (1)
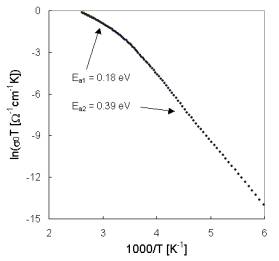
Fig. 2. Arrhenius plot of dc conductivity for glass IBPM2.
where Ea is the activation energy, k is the Boltzmann constant and T is the absolute temperature, the temperature dependencies of dc conductivity indicates two transport mechanisms with activation energies Ea1, and Ea2 for higher and
lower temperatures, respectively. Because the pre-exponential factor s0 is a function of temperature the factor sT is used in Arrhenius plots of dc conductivity. The difference in temperature dependence of all investigated glasses for the interval of higher temperatures can be seen in Fig. 3. Activation energies calculated from conventional Arheniusplots of dc conductivity for all glass samples are summarised in Tab. 3.
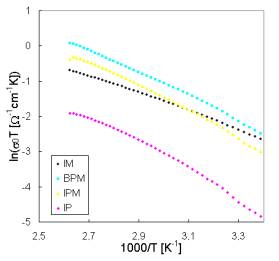
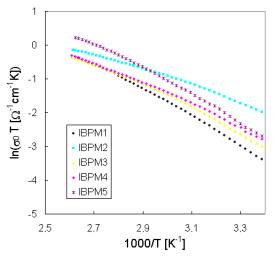
(a) (b)
Fig. 3. Arrhenius plots of dc conductivity for both systems [(a) System I; (b) System II] of glasses for temperatures allowing the determination of activation energies Ea1.
Table 3. Summary of activation energies calculated from Arrhenius plots of dc conductivity for glasses of both systems.
|
Glass sample |
Ea1 (eV) |
Ea2 (eV) |
Glass sample |
Ea1 (eV) |
Ea2 (eV) |
|
IP |
0.29 |
0.50 |
IBPM 2 |
0.18 |
0.39 |
|
IPM |
0.39 |
0.40 |
IBPM 3 |
0.27 |
0.40 |
|
BPM |
0.36 |
0.38 |
IBPM 5 |
0.33 |
0.40 |
|
IM |
0.24 |
0.32 |
IBPM 1 |
0.34 |
0.40 |
|
|
|
|
IBPM 4 |
0.25 |
0.38 |
All the prepared glasses have high ionic conductivity at room temperatures (10-2 – 10-4 W-1m-1). The samples of Systems II that contain always the same molar amount of glass-forming components exhibit very close values of activation energies Ea2 characterising the transport mechanisms at lower temperatures. The same activation energy Ea2 have also samples IPM and BPM of System I but containing the same concentrations of Cu2O-(P2O5+MoO3)components. However, the activation energies Ea1 characterising ion transport at higher temperatures depends on the ratio of CuI to CuBr responsible for Cu+ ion concentrations and indicates both similar role of both components in the process of Cu+ mobile ion governing the conductivity and mixed anioneffect.
The both activation energies determined from dc measurements as a function of glass composition for mixed CuI/CuBr halides containing the same mol. % of glass-forming components [Cu2O -(P2O5+MoO3)] are illustrated in Fig. 4. As we can
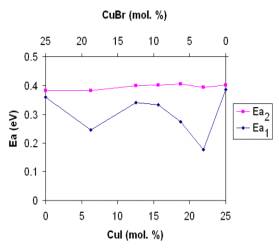
Fig. 4. Activation energies Ea1 and Ea2 as a function of glass composition for CuI/CuBr.
see the investigated glasses exhibit a strong mixed cation effect manifesting in the activation energy Ea1 of the dc conductivity. Because the activation energies Ea2 are practically constant over a wide range of glass composition of CuI/CuBr halides for the same glass forming system, they could be attributed to the same mobile Cu+ ions and/or anion distribution in the network connected only with glass forming system.
The infrared study of Cu+ ions conducting glasses in
thesimilarsystems [13,15] showed that these glasses contain mainly ![]() and
and
![]() tetrahedral
anions groups and cuprous halides as well as their mixtures do not affect
significantly the dominant phosphate and molybdate oxide structural units of
glasses.
tetrahedral
anions groups and cuprous halides as well as their mixtures do not affect
significantly the dominant phosphate and molybdate oxide structural units of
glasses.
For movement of Cu+ ions in glass structure also the nature of anion distribution in the network is important. Structure of investigated glasses changes significantly with increasing MoO3/(P2O5+MoO3) ratio [16]. With increasing content of MoO3 in glasses increases the number of non-bridging oxygens (NBO) which is associated probably with increase in polarizability of oxygen atoms.It was also found that the concentration of Cu+ ions originated from CuX halides is practically constant, only at the transition from molybdate glasses over phosphate – molybdate to phosphate glasses the concentration Cu+ ions originated from modificator Cu2O increases.But on the otherhandthe dc conductivity decreases, that can be caused by the increasing negative charge on NBO that reduces the motion (transport) of Cu+ ions and resulting effect is then the lower conductivity [17]. Mixing of cuprous halides in these systems causes a negative deviation in the activation energy from the additivity rule, which corresponds with the positive deviation in electrical conductivity.
It is also interesting to note the variation of the activation energy on the CuI/CuBr molar ratio in both systems under study. The Ea1 for the phosphate-molybdate forming system significantly varies with substitution of cuprous halides.
Most models describing the ion dynamics in mixed alkali glasses focus on the long range diffusivities of the ions. The reduced diffusivities in mixed alkali glasses as compared to single alkali glasses are attributed to interactions between dissimilar ions, to phase separation or to cation sites of different size[11,18,19].
The two, or more kinds of contributions to conductivity spectra from different sites of mobile ions are hardly identified from dc measurements.
3.2. Ac conductivity
The set of frequency dependencies of ac conductivity measured at various temperatures (conductivity spectra) is illustrated in Fig.5 for glass sample IBPM5 as representative of System II and in Fig.6 for sample IPM as representative of System I. The obtained ac conductivity measurements correspond to the complete conductivity spectra obtained from glassy samples [4,7]. However, because of limited frequency range due to the limited availability of microwave and radio, representing higher frequencies, only two regimes (II and III) of conductivity spectra due to hopping motion separated by breaks and represented by different slope on individual curves could be recognised, the regime II only at low temperatures yet.
While the glass sample IBPM5 similarly as other samples of System II exhibits one slope of brakes, the glass sample IPM as well as all samples
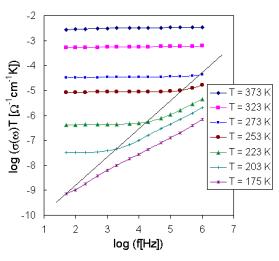
Fig.5. The frequency dependence of a.c. conductivity at various temperatures for sample IBPM 5.
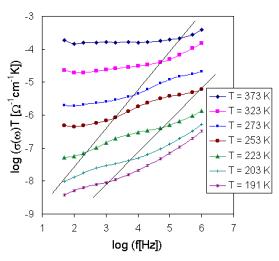
Fig.6. The frequency dependence of a.c. conductivity at various temperatures for sample IPM.
of System II exhibits evidently another brake on the ac conductivity spectra indicated another transport hopping process. It is interesting, that the samples containing only one kind of halides (System I) exhibit evidently another transport mechanism comparing with samples containing two kinds of halides (System II). Only one slope with sharper brake on the conductivity spectra registered in samples of System II is probably due to the limited frequency range so that an other hopping mechanism could be registered over the used temperature and frequency range This fact supports also the position of breaks on dc conductivity measurement curves, characterising the transition from one kind of hopping process to another.
It is known that in mixed alkali glasses, the crossover from dc to dispersive conductivity extends over a broader frequency range then in single alkali glasses [11]. It should be equivalent also to considerably higher static dielectric constant of mixed alkali glasses as compared to single alkali glasses. However, it seems that is not our case.
Low frequency plateaux in regime III and dispersive regime II are due to the hopping motion of the mobile ions and are obviously explained in terms of jump relaxation model [20] and/or modified version of jump relaxation model [7].
Considering the spectra of Fig. 6, mainly the high frequency part (regime II) caused by hopping motion of the mobile Cu+ ions, we can find that different kinds of ions are responsible for the two slopes of spectra in regime II for some glasses. The high-frequency part of the spectra can be then fitted by the relation [4]
 (2)
(2)
where s(0) is the dc conductivity, time t1 denotes the beginning of dispersive regime (t1=1/n1, where n1 is corresponding frequency). The exponents p1 and p2 can be determined from experimental results (conductivity spectra). While in regime III all successful hoppings are supposed contribute to s(w) in regime II, at angular frequency w = 2pn, only those hops are seen which are still successful at time t = 1/n. However, in the case of only one kind of sites the last term of Eq.(2) is equal zero.
A consistent explanation for the observation of the two or more
contributions to Eq. (2) can be given by the jump relaxational model
[13] including essential features of the dynamic structure
model [21]. This model considers A+ cations
occupying ![]() sites, then leaving these sites and
moving through the glass. The empty
sites, then leaving these sites and
moving through the glass. The empty ![]() sites can act
then as good targets for another A+ ions. But subsequent relaxation
of the glass network can remove empty
sites can act
then as good targets for another A+ ions. But subsequent relaxation
of the glass network can remove empty ![]() sites and
replace them with
sites and
replace them with ![]() sites represented poor targets.
Such processes allow A+ ions to enter to
sites represented poor targets.
Such processes allow A+ ions to enter to ![]() sites,
and to reconvert them into
sites,
and to reconvert them into ![]() sites. However, another kinds of
sites – wrong
sites. However, another kinds of
sites – wrong ![]() sites (wrong targets) can be
present. This model introduces then mismatch energy for processes involving
ions moving into poor or into wrong kinds of sites. The existence of empty
sites (wrong targets) can be
present. This model introduces then mismatch energy for processes involving
ions moving into poor or into wrong kinds of sites. The existence of empty ![]() and
and
![]() sites
can also explain the observed mixed halide effect.
sites
can also explain the observed mixed halide effect.
However, the Eq. (2) that can fit the experimental details does not imply the existence of only two kinds of target sites, „good“ one and „bad“ one [4]. A range of intermediate quality sites can be also present, but this is hardly distinguished from experimental conductivity spectra in spite of same attempts of theoretical explanations of experimental dates [22, 23].
3.3. Acoustic attenuation spectra
The additional informations can be obtained from acoustical spectra. The measurements of the temperature dependence of acoustic attenuation at the frequency 13 MHz indicate in all investigated samples one broad attenuation maxima at higher temperature, in which we can distinguish at least two separated peaks. At higher frequency (18 and 27 MHz) the peaks are very well recognized and at frequency 27 MHz there are registered in the case of sample IBPM5 even three peaks at higher temperatures (Fig. 7), and one another at lower temperatures.
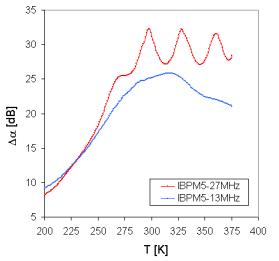
Fig. 7. Temperature dependence of acoustic attenuation measured at frequencies 13 and 27 MHz for sample IBPM5.
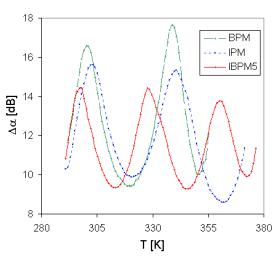
Fig. 8. The separated peaks of broad attenuation maxima measured in all investigated samples at 27 MHz frequency.
The positions of separated peaks are different for every sample (Fig. 8) and their shift with increasing frequency is evident (Fig. 7).
The peaks at the broad maxima of acoustical attenuation spectra (Fig. 7) indicate at least two basic possible transport mechanisms with the activation energies very close to those determined in dc electric measurement (Tab.3). The attenuation spectra can be explained by the assumption that temperature peaks are caused by the relaxation processes of ions in connection with different kinds of sites. Low temperature peaks are usually related to the faster ion transport and high temperature peaks are related to slower mobile ions. However, additional third mechanism is indicated by acoustic measurements comparing with dc measurements, but in accordance with some ac measurements of conductivity spectra. It should be noted, that another peak was registered also at temperatures under 200 K.
All glasses we studied using acoustic spectroscopy exhibit an Arrhenius – type relaxation between the peak temperature and the applied frequency,
n = n0 exp (-Ea / kBTpeak ) , (3)
where Ea is the activation energy, kB is Boltzmann constant, Tpeak is the temperature of the peak maximum, n is frequency and n0 is preexponential factor.
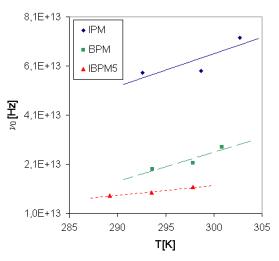
Fig. 9. The temperature dependence of pre-exponential factor at various frequencies for all samples calculated for Tpeak corresponding to Ea1.
If we look at the acoustical attenuation spectra (see Fig. 7 and Fig. 8), in the aspect of the modified jump relaxation model, the various peaks observed at different temperatures can involve the movement of Cu+ ions through hopping processes over different sites.
Using the activation energies calculated from the Arrhenius plots of the dc conductivity and the temperatures corresponding to the peaks which characterise the acoustical attenuation measurements at various frequencies (13, 18, and 27 MHz) (Tab. 4) we have found the values for pre-exponential factor n0 (Fig. 9), which depends on temperature.
Table. 4. Summary of activation energies calculated from Tpeak of acoustic attenuation measurements.
|
Glass sample |
|
|
|
IPM |
0.39 |
0.40 |
|
BPM |
0.36 |
0.38 |
|
IBPM5 |
0.33 |
0.40 |
We suppose at first approximation a linear (n0=n0´T + const.) temperature dependence of the pre-exponential factor. It seems, that the ratio of CuI and CuBr halides can be responsible for various values of the pre-exponential factor.
4. CONCLUSIONS
The experimental investigation of ion conductive glasses in system CuI-CuBr-Cu2O-(P2O5+MoO3) proved that acoustical spectroscopy in like manner as electrical conductivity spectroscopy can be very useful technique for transport mechanisms study and showed the coherence between the acoustical and electrical properties in fast ion conductive glasses. The influence of chemical composition on ion transport mechanisms was exhibited and activation energies of same transport mechanisms were determined using both dc electrical measurement and acoustical attenuation spectra.. It seems that the same mechanisms can influence electrical and acoustical losses in ion conductive glasses. The acoustical attenuation measurements are also seems even to be more sensitive can then distinguish between individual transport mechanisms that are connected with relaxation processes of mobile ions.
Further investigation measurementsof glass samples with different compositions in wider temperature and frequency range as well as with suitable shape for acoustical measurements should be done for better understanding of ion transport mechanisms, that can also help in finding the temperature dependence of the preexponential factor for various types of the investigated ion conducting glasses.
REFERENCES
[1] S. W. Martin: J. Am. Ceram. Soc. 74 (1991) 1767.
[2] M. D. Ingram: Phil. Mag. 60 (1998) 729
[3] P. Knaut and, H. L. Tuller, J. Am. Soc. 85 (2002) 1654.
[4] K. Funke andB. Roling, M. Lange, Solid State Ionics 105 (1998) 195.
[5] P. Znáši and, M. Jamnický, J. Mater. Sci. Letters14 (1995) 766.
[6] M. D. Ingra andA. H. J. Robertson, Solid State Ionics 94 (1997) 49.
[7] K. Funke, .Solid State Ionics 94 (1997) 27.
[8] P. Hockicko, P. Bury, M. Jamnický and I. Jamnický: Proc. 9th International Workshop and Appl. Phys. of Cond. Matter, Malá Lučivná 2003, 174.
[9] E. V. Charnaya, B. F. Borisov and A. A. Kuleshov, Proc. World Congress on Ultrasonics, Berlin (1995) 483.
[10] P. Bury, P. Hockicko, M. Jamnický and I. Jamnický, Proc. 32nd International Acoustical Conference – EAA Symposium, Banská Štiavnica (2002) 67.
[11] B. Roling, A. Happe, M. D. Ingram and K. Funke, J. Phys. Chem. B 103 (1999) 4122.
[12] I. Tureková, Czech. J. Phys. B 23 (1973), 1137.
[13] P. Znášik and M. Jamnický: SolidState Ionics 95 (1997) 207.
[14] Ch. Lin and C. A. Angel, SolidState. Ionics 13 (1984) 105.
[15] M. Jamnický, P. Znášik, D. Tunega and M. D. Ingram J. Non-Cryst. Solids 185 (1995) 15.1
[16] P. Znáši ,and M. Jamnický, J. Non-Cryst. Solids,146 (1992) 74.
[17] M. Jamnický, J. Sedláček and P. Znášik Solid State Phenomena 90-91 (2003) 221.
[18]M. D. Ingram, Phys. Chem. Glasses 28 (1987) 215.
[18] R. K. Sato, R. J. Kirkpatrick ,and R. K. Brow, J. Non-Cryst. Solids 43 (1992) 257.
[19] A. Bunde, K. Funke and M. D. Ingram, Solid State Ionics 86-88 (1996) 1311
[20] P. Znášik, M. Jamnický, J. Híveš andM. Mika, Ceramics – Silikáty, 37 (1993) 153.
[21] B. Roling, C. Martiny and S. Murugavel, Phys. Rev. Letters 87 (2001) 085901.
[22] S. Murugavel and B. Roling, Phys.. Rev. Letters 89 (2002) 195902.
Acknowledgements
The authors would like to thank Mr. F. Černobila for technical assistance. This work was partly financially supported by Grant 1/9141/ 02 of the Ministry of Education of the Slovak Republic.