Introduction
The acoustic spectroscopy investigation of ion conductive glasses can reflect the basic features of the relaxation and transport mechanisms of the mobile ions. The acoustic attenuation measurements seem to be a useful technique for non-destructive investigation of transport mechanisms in conductive glasses and compared to the electrical ones they have even some advantages as high sensitivity, the absence of contact phenomena and so on [1,2].
The experimental study of transport mechanisms in glassy electrolytes with fast ion transport attracts the considerable attention for its important role in a number of modern electrochemical devices such assolid-state batteries, solid-oxide fuel cells, electrochemical sensors, electrochronic displays and oxygen-separation membranes. The fabrication of electrochemical batteries with high energy density and capacity, excellent reversibility, long-time stability and low cost is a necessary part of this development. Other applications, such as portable batteries for heart pacemaker, mobile telephones and laptop computers, have, in recent years, markedly increased the need for solid-state microbatteries with high energy density. Lithium-ion batteries are the most obvious choice given their low mass and high cell potentials [2].
The general requirements for practical solid electrolytes are high ionic conductivity, negligible electronic conductivity, stability with respect to adjacent phases and to thermal and electrochemical decomposition, suitable mechanical properties, ready availability of chemical constituents, easy of fabrication and reasonable cost.
Phosphate glasses containing Cu+ conductive ions are good ionic conductors with room temperature conductivity of the order 10-3 W-1cm-1. The highest conductivity has been recorded in systems containing large fractions of cuprous halides, such as CuI or CuBr [3].
The investigation of acoustic spectra in ion conductive glasses with different composition can reflect the basic features of the relaxation and transport processes of the mobile ions.It was found that the temperature responses of all acoustic spectra are similar and the relaxation peaks associated with ion transport depend on the glass composition [4].
In the contribution we present both acoustic and conductivity spectra of phosphate glasses containing Cu+ conductive ions in the system CuI-CuBr-Cu2O-P2O5 with respect to investigate ion transport mechanisms and to determine the relation between acoustical and electrical properties considering the various glass compositions with purpose to study ion transport mechanisms in these ion conductive glasses and to find the role of cuprous halides producing Cu+ ions.
Experiments
The procedure of glasses preparation in the system CuI-CuBr-Cu2O-P2O5 has been already described [5]. The set of systems of glasses was originally prepared to investigate the role of cuprous halides producing Cu+ ion keeping their ratio to the glass forming system constant [4]. The samples for acoustical attenuation measurements were cylindrical in shape (area » 1 cm2, thickness 1.6 - 2.0 mm) and end faces were polished to be flat and parallel. The composition of the complex set of glass presented samples are summarised in Tab. 1.
Tab. 1 Starting glass compositions (in mol.%)of prepared glasses
|
Glass |
Composition (in mol.%) |
|||
|
sample |
CuI |
CuBr |
Cu2O |
P2O5 |
|
BIDP1 |
15,91 |
2,27 |
54,55 |
27,27 |
|
BIDP2 |
13,63 |
4,55 |
54,55 |
27,27 |
|
BIDP3 |
11,36 |
6,82 |
54,55 |
27,27 |
|
BIDP5 |
9,09 |
9,09 |
54,55 |
27,27 |
|
BIDP6 |
6,82 |
11,36 |
54,55 |
27,27 |
|
BIDP7 |
4,55 |
13,63 |
54,55 |
27,27 |
|
BIDP8 |
2,27 |
15,91 |
54,55 |
27,27 |
|
BDP |
0 |
18,18 |
54,55 |
27,27 |
The acoustical attenuation was measured using longitudinal acoustic wave of frequency 13, 18 and 27 MHz generated by quartz transducer in temperature range of 140-380 K. The quartz buffer was used to separate the signal from quite short sample (Fig. 1).
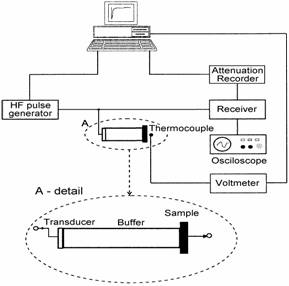
Fig. 1Experimental arrangement foracoustic attenuation measurement
The temperature and frequency dependencies of electrical conductivity (dc and ac in the frequency range 50 Hz - 1 MHz) were measured in the same temperature range as acoustical measurements. The measured complex impedance allowed us to obtain the bulk dc and ac conductivity of glass samples by means of the usual impedance analysis. Gold electrodes were sputtered on to the sample surfaces for electrical investigation.
Results and discussion
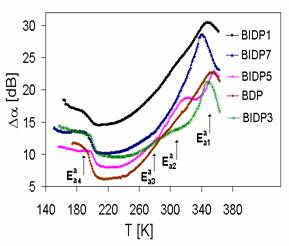
Fig. 2 Acoustic attenuation spectra of ion conductive glasses of the system CuI-CuBr-Cu2O-P2O5
The acoustic attenuation of the mostinvestigated ion conducting glasses is plotted as a function of temperature at a constant frequency n= 18 MHz (Fig. 2).
The measurements of the temperature dependence of acoustic attenuation indicate in all investigated samples one broad attenuation peak at higher temperature, in which we initially supposed two separated peaks [6]. But using the theoretical models [7] we fitted the acoustic attenuation spectrum and the superposition of three calculated lines represented by cross-markedline
in Fig. 3 gave an excellent agreement with measured spectrum in whole temperature range.
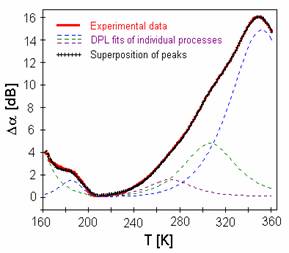
Fig. 3 Acoustics spectrum of sample BIDP1 (full line). Cross-markedline represents the best fit of superposition at least four relaxation processes
.
We tried to use double power law (DPL) model to fit the acoustic attenuation spectra of the investigated glasses. This function has mainly been used to fit mechanical loss data [8]
|
|
|
(1) |
where m and n are the power-law exponents and t is the relaxation time.
The distinctive peaks of acoustic attenuation spectra, which are caused by resonant interaction with the mobile ion hopping processes, enable us then to study relaxation and transport mechanisms in the ion conductive glasses. The attenuation spectra can be explained by the assumption that temperature peaks are caused by the relaxation processes of mobile Cu+ ions in connection with different kinds of sites.
The temperature dependence of acoustic attenuation has been analyzed then assuming the existence of four thermally activated relaxation processes of ions in connection with different kinds of sites. The fourth peak, however, was detected at lower temperatures.
All glasses we studied using acoustic spectroscopy exhibit an Arrhenius – type relaxation between the peak temperature and the applied frequency
|
|
n = n0 exp (- |
(2) |
where![]() is the activation energy, kB
is Boltzmann constant, Tpeak is the temperature of the peak
maximum, n is the frequency and n0 is the preexponential factor. The values of Tpeak can be
easily and directly determined from the theoretical fits.
is the activation energy, kB
is Boltzmann constant, Tpeak is the temperature of the peak
maximum, n is the frequency and n0 is the preexponential factor. The values of Tpeak can be
easily and directly determined from the theoretical fits.
The existence of fourbasic possible thermally activated relaxation processes of ions (![]() ,
,![]() ,
,![]() )for higher and
)for higher and ![]() for lower temperatures) are connected with different kinds of sites for Cu+ ions.
for lower temperatures) are connected with different kinds of sites for Cu+ ions.
Using the values of Tpeak for individual peaks and Eq. (2), the activation energies were determined (Tab. 2).
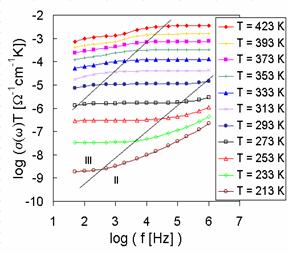
The ion transport properties of ionic conductors can be also directly reflected in the electrical conductivity spectra [7].
The representative results of measured dc conductivity (BIDP1) as a function of temperature are illustrated in Fig. 4. As all of the temperature dependence of dc glass conductivity can be fitted by the equation
|
|
s= s0 exp ( -Ea / kBT ) . |
(3) |
Because the preexponential factor s0 is a function of temperature, the factor sT is used in Arrhenius plots of dc conductivity. The temperature dependence of dc conductivity of all samples indicates four transport mechanisms with activation energies Ea1, Ea2, Ea3 and Ea4. The shapes of experimental Arrhenius plots of dc conductivity indicate also some association and dissociation processes, respectively connected with defects formation [2].
Activation energies calculated from conventional Arrhenius plots of dc conductivity for all glass samples are summarized in Tab. 2, too.
As we can see the investigated glasses exhibit a mixed cation effect. All prepared glasses have high ionic conductivity at room temperatures 10-2- 10-4W-1cm-1.
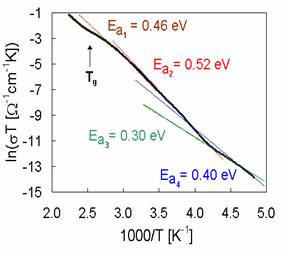
Fig. 4 Arrhenius plot of