Tab. 1. Starting compositions (in mol. %) of prepared glasses
|
Glass |
|
|
Composition (in mol.%) |
|
|||
|
ample |
CuI |
CuBr |
Cu2O |
P2O5 |
|||
|
BIDP1 |
15,91 |
2,27 |
54,55 |
27,27 |
|||
|
BIDP2 |
13,63 |
4,55 |
54,55 |
27,27 |
|||
|
BIDP3 |
11,36 |
6,82 |
54,55 |
27,27 |
|||
|
BIDP5 |
9,09 |
9,09 |
54,55 |
27,27 |
|||
|
BIDP6 |
6,82 |
11,36 |
54,55 |
27,27 |
|||
|
BIDP7 |
4,55 |
13,63 |
54,55 |
27,27 |
|||
|
BIDP8 |
2,27 |
15,91 |
54,55 |
27,27 |
|||
|
BDP |
0 |
18,18 |
54,55 |
27,27 |
|||
The acoustical attenuation was measured using MATEC attenuation comparator for longitudinal acoustic wave of frequency 13, 18 and 27 MHz generated by quartz transducer in the temperature range of 140-380 K. The quartz buffer was used to separate the signal from quite short sample. The samples for acoustical attenuation measurements were cylindrical in shape (area » 1 cm2, thickness » 2 mm) and end faces were polished to be flat and parallel.
The temperature and frequency dependencies of electrical conductivity (dc and ac in the frequency range from 50 Hz up to 1 MHz) were measured using FLUKE PM 6306 impedance analyzer in the same temperature range as acoustical measurements. The measured complex impedance allowed us to obtain the bulk dc and ac conductivity of glass samples by means of the usual impedance analysis. Gold electrodes were sputtered on to the sample surfaces for electrical investigation.
3. RESULTS AND DISCUSSION
3.1. Conductivity spectra
The representative results of measured dc conductivity (samples BIDP1 and BIDP7) as a function of temperature are illustrated in Fig. 1. As all of the temperature dependence of dc glass conductivity can be fitted by the equation
s= s0exp(-Ea/kT), (1)
where Ea is the activation energy, k is the Boltzman constant and T is the absolute temperature, the temperature dependencies of dc conductivity indicates at least three transport mechanisms with activation energies Ea1, and Ea2 for higher and Ea3 for lower temperatures, respectively. The shapes of experimental Arrhenius plots of dc conductivity indicate also some association and dissociation processes, respectively connected with defects formation [11]. Because the pre-exponential factor s0 is a function of temperature the factor sT is used in Arrhenius plots of dc conductivity.
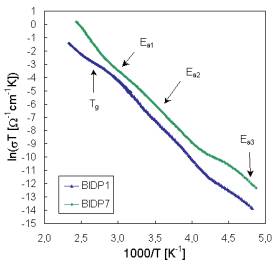
Fig. 1. Arrhenius plot of dc conductivity for glasses BIDP1 and BIDP7.
Activation energies calculated from conventional Arrhenius plots of dc conductivity for all glass samples are summarized in Tab. 2. All prepared glasses have high ionic conductivity at room temperatures (10-2-10-4W-1cm-1).
Tab. 2. Summary of activation energies calculated from Arrhenius plots of dc conductivity.
|
Sample |
|
|
|
|
BIDP1 |
0.46 |
0.52 |
0.40 |
|
BIDP2 |
0.44 |
0.54 |
0.44 |
|
BIDP3 |
0.46 |
0.58 |
0.42 |
|
BIDP5 |
0.44 |
0.54 |
0.42 |
|
BIDP6 |
0.39 |
0.52 |
0.43 |
|
BIDP7 |
0.41 |
0.50 |
0.43 |
|
BIDP8 |
0.42 |
0.52 |
0.41 |
|
BDP |
0.40 |
0.51 |
0.38 |
The both activation energies Ea1 and Ea2 determined at higher temperatures from dc measurements as a function of glass composition for mixed CuI/CuBr halides containing the same mol. % of glass-forming components (Cu2-P2O5) varies significantly with substition of cuprous halides. Mixing of two cuprous halides always couses a negative deviation in the activation energy from the additivity rule [12]. As we can see the investigated glasses exhibit a strong mixed cation effect manifesting in the activation energies Ea1 and Ea2.
The infrared study of Cu+ ions conducting glasses in the same
systems [12] showed that these glasses contain mainly ![]() , and tetrahedral anions groups and cuprous halides as well
as their mixtures do not affect significantly the dominant phosphate oxide
structural units of glasses.
, and tetrahedral anions groups and cuprous halides as well
as their mixtures do not affect significantly the dominant phosphate oxide
structural units of glasses.
Most models describing the ion dynamics in mixed alkali glasses focus on the long range diffusivities of the ions. The reduced diffusivities in mixed alkali glasses as compared to single alkali glasses are attributed to interactions between dissimilar ions, to phase separation or to cation sites of different size [7,13,14].
The set of frequency dependencies of ac conductivity measured at various temperatures (conductivity spectra) is illustrated in Fig. 2 for glass sample BIDP3 as representative of investigated system. The obtained ac conductivity measurements correspond to the complete conductivity spectra obtained from glassy samples [3,4]. However, because of limited frequency range only two regimes (II and III) of conductivity spectra due to hopping motion could be recognized, the regime II only at low temperatures yet.
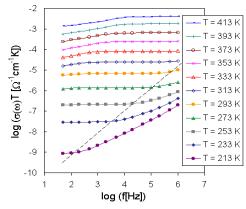
Fig. 2. The frequency dependence of ac conductivity at various temperatures for sample BIDP3.
The glass sample BIDP3 similarly as other samples exhibits one slope of brakes on the ac conductivity spectra indicated another transport hopping process. However, the jump from one value of ac conductivity to another was registered at higher temperatures and lower frequencies. This fact supports also the shape of dc conductivity measurement curves, characterizing the transition from one kind of hopping process to another.
Low frequency plateaux in regime III and dispersive regime II are due to the hopping motion of the mobile ions and are obviously explained in terms of jump relaxation model [15] and/or modified version of jump relaxation model considering several kinds of cation sites [4].
While in regime III all successful hoppings are supposed contribute to s(w) in regime II, at angular frequency w = 2pn,
only those hops are seen which are still successful at time t = 1/n. A consistent explanation for the observation of two or more
contributions to hopping mechanism can be given by the jump relaxational model
[9] including essential features of the dynamic structure model [16]. This
model considers A+ cations occupying ![]() sites,
sites, ![]() sites represented
poor targets and wrong
sites represented
poor targets and wrong ![]() sites (wrong
targets). This model introduces then mismatch energy for processes involving
ions moving into poor or into wrong kinds of sites. The existence of empty
sites (wrong
targets). This model introduces then mismatch energy for processes involving
ions moving into poor or into wrong kinds of sites. The existence of empty ![]() and
and ![]() sites can also
explain the observed mixed halide effect.
sites can also
explain the observed mixed halide effect.
A range of intermediate quality sites can be also present, but this is hardly distinguished from experimental conductivity spectra in spite of same attempts of theoretical explanations of experimental dates [17,18].
3.2. Acoustic attenuation spectra
The additional information can be obtained from acoustical spectra. The measurements of the temperature dependence of acoustic attenuation at all frequencies indicate and in all in investigated samples one broad attenuation maxima at higher temperature, in which we can distinguish at least two separated peaks. At higher frequencies (18 and 27 MHz) the peaks are very well recognized and at frequency 27 MHz there are registered even peak corresponding to transition temperature Tg (Fig. 3). One another peak was registered also at lower temperatures. The change of position and proportion of the broad maxima peaks can be seen in Fig. 4 illustrating the acoustic attenuation spectra measured at 18 MHz.
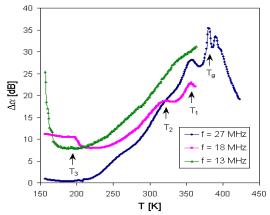
Fig. 3. Temperature dependence of acoustic attenuation measured at frequencies 13, 18 and 27 MHz for sample DIDB3.
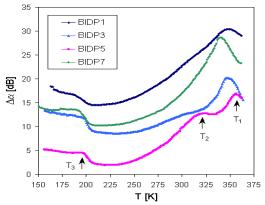
Fig. 4. The set of attenuation spectra of samples BIDP1,3,5,7 measured at frequency 18 MHz.
The peaks at the broad maxima of acoustical attenuation spectra (Fig. 4) indicate at least two basic possible transport mechanisms with the activation energies that are shifted comparing to those determined in dc electric measurement (Tab. 2). The attenuation spectra can be explained by the assumption that temperature peaks are caused by the relaxation processes of ions in connection with different kinds of sites. Low temperature peaks are usually related to the faster ion transport and high temperature peaks are related to slower mobile ions. However, additional third mechanism indicated by acoustic measurements at lower temperatures (~ 200 K) does not correspond to the energy Ea3 from dc measurement.
All glasses we studied using acoustic spectroscopy exhibit an Arrhenius – type relaxation between the peak temperature and the applied frequency
n = n0 exp (-Ea / kBTpeak ) , (2)
where Ea is the activation energy, kB is Boltzmann constant, Tpeak is the temperature of the peak maximum, n is the frequency and n0 is the pre-exponential factor. The peak temperatures in Fig. 3 and Fig.4 are signed as T1, T2 and T3, respectively. If we look at the acoustical attenuation spectra (see Fig. 3 and Fig. 4) in the aspect of the modified jump relaxation model, the various peaks observed at different temperatures can involve the movement of Cu+ ions through hopping processes over different sites. Using the Eq. (2) and values of Tpeak for individual peaks, the activation energies Eaa were determined (Tab. 3). The acoustical spectra measured at 27 MHz enable us to determine also Tg points, that mostly coincide very well with values determined by differential thermal analysis (DTA).
Tab. 3. Summary of activation energies calculated from Tpeak of acoustic attenuation measurements.
|
Sample |
|
|
|
|
|
BIDP1 |
0.47 |
0.41 |
0.25 |
395 |
|
BIDP2 |
0.46 |
0.41 |
0.27 |
384 |
|
BIDP3 |
0.46 |
0.41 |
0.26 |
390 |
|
BIDP5 |
0.46 |
0.42 |
0.26 |
380 |
|
BIDP6 |
0.46 |
0.42 |
0.28 |
379 |
|
BIDP7 |
0.45 |
0.42 |
0.25 |
377 |
|
BIDP8 |
0.46 |
0.43 |
0.27 |
372 |
|
BDP |
0.47 |
0.43 |
0.26 |
379 |
4. CONCLUSIONS
The experimental investigation of ion conductive glasses in system CuI-CuBr-Cu2-P2O5 proved that acoustical spectroscopy in like manner as electrical conductivity spectroscopy can be very useful technique for transport mechanisms study and showed the coherence between the acoustical and electrical properties in fast ion conductive glasses. The influence of chemical composition on ion transport mechanisms was exhibited and activation energies of some transport mechanisms were determined using both dc electrical measurement and acoustical attenuation spectra. It seems that the same mechanisms can influence electrical and acoustical losses in ion conductive glasses. The acoustical attenuation measurements are also seems even to be very sensitive and can then distinguish between individual transport mechanisms that are connected with relaxation processes of mobile ions. Further investigation of glass samples with different compositions in wider temperature and frequency range with shape suitable for acoustical measurements should be done for better understanding of ion transport mechanisms.
REFERENCES
[1] S.W. Martin, J. Amer. Ceram. Soc. 7( 91991) 1767.
[2] M.D.Ingram, Phil. Mag. 60 (1998) 729.
[3]K. Funke, B. Roling, M. Lange, Sol. State Ionics 105 (1998) 195.
[4] K. Funke, Sol. State Ionics 94 (1997) 27.
[5] P. Hockicko, P. Bury, M. Jamnicky and I. Jamnicky, Proc. 9th International Worshop and LAppl. Phys. of Cond. Matter, Mala Lucivna 2003, 174.
[6] E. V. Charnaza, B. F. Borisov, A. A. Kuleshov, Proc. World Congress on Ultrasonics, Berlin (1995) 483.
[7] B. Roling, A. Happe, M. D. Ingram and K. Funke, J. Phys. Chem. B 103 (1999) 4122.
[8] I. Turekova, Czech. J. Phys. B 23 (1973), 1137.
[9] P. Znasik, M. Jamnicky, J. Mat Science Letter 14 (1995) 766.
[10] P. Znasik and M. Jamnicky, Solid St. Ionics 95 (1997) 207.
[11] P. Knauth, H. L. Tuller, J. Am. Ceram. Soc., 85 (2002) 1654.
[12] P. Znasik, M. Jamnicky, Solid St. Ionics, 92 (1996) 145.
[13] M. D. Igram, Phys. Chem. Glasses (1987) 28,215.
[14] R. K. Sato, R.J. Kirkpatrick, R. K. Brow, J. Non-Cryst.. Solids (1992) 143, 257.
[15] A. Bunde, K. Funke and M. D. Ingram, Solid State Ionics 86-88 (1996) 1311.
[16] P. Znasik, M. Jamnicky, J. Hives, M. Mika, Ceramics-Silikaty, 37 (1993) 153.
[17] B. Roling, C. Martiny, S. Murugavel, Phys. Rev. Letters 87 (2001) 085901.
[18] S. Murugavel, B. Roling, Phys. Rev. Letters 89 (2002) 195902.
Acknowledgements
The authors would like to thank Mr. F. Cernobila for technical assistance. this work was partly financially supported by Grant 1/914/02 of the Ministry of Education of the Slovak Republic.