The Investigation of Transport Processes in Ion Conductive Glasses Using Acoustical and Electrical Spectroscopy
Žilina
University, Faculty of Electrical Engineering,
Department of Physics, Veľký diel,
010 26 Žilina,
E-mail: hockicko@fyzika.utc.sk
Žilina
University, Faculty of Electrical Engineering,
Departmentof Fundamental Engineering, kpt. J. Nálepku 1390, 031 01 Liptovský Mikuláš,
Slovak
University of Technology, Faculty of Chemical and Food Technology,
Departmentof Ceramic, Glass and Cement, Radlinského 9, 812 37
A considerable interest is given in experimental study of glassy materials with the fast ion transport because they play an important role in a number of modern electrochemical devices. The relaxation and transport mechanisms in ion conductive glasses can be investigated by both acoustical spectroscopy and electrical investigation represented by conductivity spectroscopy. In the contribution we present some acoustical and electrical measurements utilized in the study of transport mechanisms and relaxation processes occurring in these glasses and some physical parameters are determined. Coherence between the acoustical and electrical properties is discussed, too.
Keywords: ion conductive glasses; relaxation and transport processes; acoustical, electrical properties
1 Introduction
It is known that the investigations of acoustic and conductivity spectra of ion conductive glasses reflect the basic features of the relaxation and transport mechanisms of the mobile ions. But acoustic measurements compared to the electrical ones can have even some advantages as high sensitivity, the absence of contact phenomena and so on [1,2]. The acoustic attenuation measurements (acoustic spectra) and ac conductivity measurements (conductivity spectra) seem to be the useful techniques for investigation of transport and relaxation processes in ion conductive glasses.
The experimental study of transport mechanisms in glassy electrolytes with fast ion transport attracts the considerable attention for its important role in a number of modern electrochemical devices such assolid-state batteries (portable batteries for heart pacemaker, mobile telephones and laptop computers), solid-oxide fuel cells, electrochemical sensors, electrochronic displays and oxygen-separation membranes. Lithium-ion batteries are the most obvious choice given their low mass and high cell potentials [2].
Phosphate glasses containing Cu+ conductive ions are good ionic conductors with room temperature conductivity of the order 10-3 W-1m-1. The highest conductivity has been recorded in systems containing large fractions of cuprous halides, such as CuI or CuBr [3].
In this contribution we present experimental results obtained by acoustic and electrical investigation of the set of glasses prepared in the system CuI-CuBr-Cu2O-P2O5 with the purpose to study ion transport mechanisms in these ion conductive glasses and to determine the relation between acoustical and electrical properties considering the various glass compositions to find the role of cuprous halides producing Cu+ ions.
2 Experiments and results
The procedure of glass preparation in the system CuI-CuBr-Cu2O-P2O5 has been already described [4]. The set of glasses was originally prepared to investigate the role of cuprous halides producing Cu+ ion keeping their ratio to the glass forming system (Cu2O-P2O5) constant. The compositions of the complex set of glass samples are summarized in Tab. 1.
|
Glass |
Composition (in mol. %) |
|||
|
Sample |
CuI |
CuBr |
Cu2O |
P2O5 |
|
BIDP1 |
15.91 |
2.27 |
54.55 |
27.27 |
|
BIDP2 |
13.63 |
4.55 |
54.55 |
27.27 |
|
BIDP3 |
11.36 |
6.82 |
54.55 |
27.27 |
|
BIDP5 |
9.09 |
9.09 |
54.55 |
27.27 |
|
BIDP6 |
6.82 |
11.36 |
54.55 |
27.27 |
|
BIDP7 |
4.55 |
13.63 |
54.55 |
27.27 |
|
BIDP8 |
2.27 |
15.91 |
54.55 |
27.27 |
|
BDP |
0 |
18.18 |
54.55 |
27.27 |
Tab. 1. Starting glass compositions (in mol. %)of prepared glasses
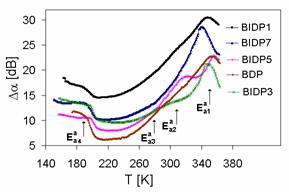
The acoustical attenuation was measured using longitudinal acoustic wave of frequency 13, 18 and 27 MHz in the temperature range 140-380 K [5]. The temperature and frequency dependencies of electrical conductivity (dc and ac in the frequency range 50 Hz - 1 MHz) were also measured in the same temperature range as acoustical measurements [4]. The acoustic attenuation of the most ofinvestigated glasses is plotted as a function of temperature at the constant frequency n= 18 MHz in Fig. 1. The measurements indicate in all samples one broad attenuation peak at higher temperature, in which we can distinguish at least two separated peaks. Another peak was detected at lower temperatures as a part of broader peak.
|
Fig. 1. Acoustic attenuation spectra of investigated ion conductive glasses for different glass composition. The individual spectra are shifted for better resolution. |
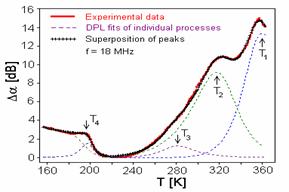
Fig. 2. Acoustics spectrum of sample BIDP5 (full line). Cross-marked line represents the best fit of superposition at the smallest four relaxation processes. |
The acoustic attenuation will exhibit a maximum when the relaxation time t is comparable to the period (1/w) of the acoustic perturbation, where
|
|
|
(1) |
is the most probable relaxation time. The
relaxation processes described by this Arrhenius equation
are characterized by activation energy ![]() for jumps over
the barrier between two potential minima and typical values for preexponential factor 1/t0 = υ0 » 1013–1014 s-1.
Here
for jumps over
the barrier between two potential minima and typical values for preexponential factor 1/t0 = υ0 » 1013–1014 s-1.
Here ![]() is the temperature of peak
maximum and kB is the Boltzman constant.
The relaxation
phenomena observed in a wide variety of materials exhibit a double power-law
type of frequency dependence, the relationship to Debye
behaviour can be then expressed in form [6]
is the temperature of peak
maximum and kB is the Boltzman constant.
The relaxation
phenomena observed in a wide variety of materials exhibit a double power-law
type of frequency dependence, the relationship to Debye
behaviour can be then expressed in form [6]
|
|
|
(2) |
where m and n are power-law exponents, which take values between 0 and 1. When m = 1 and n = 1, Eq. (2) reduces to the equation for a single Debye-like process. Using the theoretical model with double power-law function, the calculated lines gave an excellent agreement with the measured spectrum in the whole temperature range. The representative acoustic spectrum and its theoretical simulation is illustrated in Fig. 2. The temperature dependences of acoustic attenuation were then analyzed assuming the existence of four thermally activated relaxation processes of Cu+ ions in connection with different kinds of sites. The proportion of peak intensities depends on the glass composition, namely on the ratio CuI/CuBr (mixing cation effect).
|
Fig. 3. Arrhenius plot of d.c. conductivity of sample BIDP5. |
Fig. 4. The frequency dependence of ac conductivity at various temperatures for sample BIDP5. |
The ion transport properties of investigated solid electrolytes are also reflected in the electrical conductivity spectra [4,5]. The temperature dependences of dc conductivity indicate four different transport mechanisms with activation energies Ea1, Ea2, Ea3 and Ea4 (Fig. 3) including also some association and dissociation processes (Ea2, Ea3) connected with some defects formation [2,4]. The frequency dependencies of ac conductivity (Fig. 4) measured at various temperatures (conductivity spectra) exhibit two slope of brakes characterizing the transition from dc conductivity to dispersive conductivity indicating thus the transition between various transport hopping processes [1,4].
The activation energies calculated from Arrhenius plots of the dc conductivity and determined using the values of Tpeak for individual peaks from Eq. (1) are summarized in Tab. 2.
|
Glass Sample |
Electrical measurements |
Acoustical measurements |
|||||||||||
|
|
|
|
|
|
|
|
|
||||||
|
BIDP1 |
0.46 |
0.52 |
0.30 |
0.40 |
0.47 |
0.41 |
0.37 |
0.25 |
|||||
|
BIDP2 |
0.44 |
0.54 |
0.41 |
0.44 |
0.46 |
0.41 |
0.36 |
0.27 |
|||||
|
BIDP3 |
0.46 |
0.58 |
0.30 |
0.42 |
0.46 |
0.41 |
0.37 |
0.26 |
|||||
|
BIDP5 |
0.44 |
0.54 |
0.33 |
0.42 |
0.46 |
0.42 |
0.33 |
0.26 |
|||||
|
BIDP6 |
0.39 |
0.52 |
0.35 |
0.43 |
0.46 |
0.42 |
0.35 |
0.28 |
|||||
|
BIDP7 |
0.41 |
0.50 |
0.23 |
0.43 |
0.45 |
0.42 |
0.39 |
0.25 |
|||||
|
BIDP8 |
0.42 |
0.52 |
0.26 |
0.41 |
0.46 |
0.43 |
0.36 |
0.27 |
|||||
|
BDP |
0.40 |
0.51 |
0.15 |
0.38 |
0.47 |
0.43 |
0.39 |
0.26 |
|||||
|
|
|
|
|
|
|
|
|
|
|
|
|
|
|
Tab. 2. Activation energies calculated from Arrhenius plots of the dc conductivity and acoustic spectra.
3 Conclusion
Connection of acoustic and electrical conductivity spectroscopies can be very useful tool for the study of transport mechanisms. They enable also very sensitively to distinguish between individual transport mechanisms.
After comparing the acoustic and electrical measurements we can see that some of the individual transport mechanisms indicated by acoustical spectra can correspond to the mechanisms indicated by electrical measurement, but some can be different because of both different microscopic mechanisms for relaxation processes and the temperature dependence of preexponential factor n0 [5].
Acknowledgements
The authors would like to thank Mr. F. Černobila for technical assistance. This work was partly financially supported by Grant 1/9141/02 of the Ministry of Education of the Slovak Republic.
References
[1] B. Roling, A. Happe, M. D. Ingram and K. Funke,Interrelation between Different Mixed Cation Effects in the Electrical Conductivity and Mechanical Loss Spectra of Ion Conducting Glasses,J. Phys. Chem. B 103 (1999) 4122-4127.
[2] P. Knauth, H. L. Tuller, Solid-State Ionics: Root, Status, and Future Prospects, J. Am. Ceram. Soc., 85 [7] (2002) 1654-80.
[3] P. Znášik and M. Jamnický,Cu+-ion-conducting properties of mixed-halide metaphosphate and orthophosphate glasses, Solid State Ionics 95 (1997) 207-214.
[4] P. Bury, P. Hockicko, M. Jamnický and
[5] P. Bury, P. Hockicko, M. Jamnický and I. Jamnický, On The Relation Between Electrical And Acoustical Properties of Ion Conductive Glasses, Advances in Electrical and Electronic Engineering, Vol. 2 (2003), No. 3-4, 16-23.
[6] P. Hockicko, P. Bury, S. Jurečka, M. Jamnický and I. Jamnický, Analysis of Acoustic Spectra Reflected Ion Transport Processes in Glassy Electrolytes, Advances in Electrical and Electronic Engineering, Vol. 3 (2004), No.2, 243-246.