Analysis of conductivity spectra in ionic phosphate glasses
P. Hockicko(1), P. Bury(1) , S. Jurečka(2) , M. Jamnický(3) , I. Jamnický(1)
(1)Department of Physics, Faculty of Electrical Engineering, University of Žilina, Veľký Diel, 010 26 Žilina, Slovak Republic
(2)Department of Fundamental Engineering, Faculty of Electrical Engineering, University of Žilina, kpt. J. Nálepku 1390, 031 01 Liptovský Mikuláš
(3)Department of Ceramic, Glass and Cement, Faculty of Chemical and Food Technology, Slovak University of Technology, Radlinského 9, 812 37 Bratislava
e-mail: hockicko@fyzika.utc.sk
Introduction
The frequency dependence of electrical conductivity of many solids including glasses, polymers and crystals is usually described by the so called “universal law” or “universal dynamic response” and consists of a frequency independent and strongly frequency dependent components that can be for a limited frequency region approximated by the following simple relation [1]:
|
|
|
(1) |
where s(0)is the frequency independent dc (or low-frequency) conductivity and the exponent s lies in the range 0 < s £ 1, mostly s » 0.5 – 0.7, w (=2pf) is angular frequency of measurement. The both s(0) and A follow Arrhenius type strong temperature dependencies.
Nowadays, everybody seems to agree that ionic conduction in glasses, at least in the dc regime and in the ac regime at not too high frequencies, is due to hopping of ions between localized states in the glass matrix [2]. However, the mechanism of such hopping is the subject of many controversies [3]. Several models were proposed to explain this behaviour [4].
All models are based upon series processes and the two contributions in Eq. (1), s(0) and Aws arises from the same relaxation process. The non-Debye character of the relaxation is due to the fact that the time constant of the back-hop process increases as time process. This assumption leads to the frequency dependence of conductivity given by Eq. (1) in the low frequency range while a plateau should be observed in the high temperature region. The models predict that A is thermally activated with an activation energy Eac related to the activation energy of dc conductivity Edc.
In this contribution we present an analysis of the electrical spectra of representative samples of phosphate glasses containing Cu+ conductive ions in the system CuI-CuBr-Cu2O-P2O5 with the purpose to study the ion transport mechanisms in these fast ion conductive glasses. Theoretical studies of electrical spectra due to the ionic hopping motion and relaxation processes connected with the mobility of Cu+ conductive ions are compared with experimental results.
Results and discussion
The procedure of glasses preparation in the system CuI-CuBr-Cu2O-P2O5 from commercial reagents has been already described [5, 6] and the composition of the complex set of glass samples has been summarized [7]. We tried to fit the measured temperature-dependent electrical conductivity spectra at frequency from n= 50Hz to 1MHz including dc measurements.
|
Fig. 1. Frequency dependence of the electrical conductivity for sample IDP. |
Fig. 2. Temperature dependence of the electrical conductivity for sample IDP. |
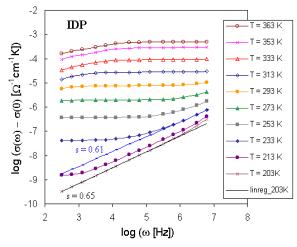
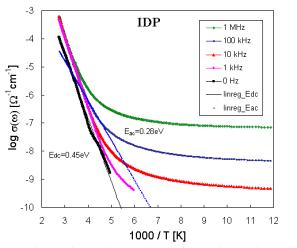
The set of frequency dependences of ac conductivity measured at various temperatures (conductivity spectra) is illustrated in Fig. 2 for glass sample IDP (starting glass composition in mol. % - CuI: 18.18, Cu2O: 54.55, P2O5: 27.27) as representative of investigated system. The obtained ac conductivity measurements correspond to the complete conductivity spectra obtained from glassy samples [8, 9]. Because of limited frequency range only two regimes (II and III) of conductivity spectra due to hopping motion could be recognized. However, an additional deviation of conductivity from the flat dc plateau is observed at low frequencies and high temperatures. This additional dispersion is obviously referred to electrode polarization [1]. But our previous dc measurements [10] indicate at least three transport mechanisms with activation energies Ea1, and Ea2 for higher and Ea3 for lower temperatures, respectively. The shapes of experimental Arrhenius plots of dc conductivity indicate also some association and dissociation processes, respectively connected with defects formation. Following these results the shift of the frequency independent component of conductivity can represent different hopping centers or different type of ions.
The temperature dependences of conductivity (log s against 1/T) illustrated in Fig. 2 for one of sample set enabled to obtain activation energies Eac.
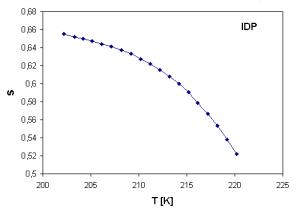
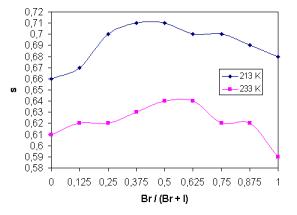
The temperature dependence of parameter s and its dependence on glass composition are shown in Fig. 3 and Fig. 4, respectively. The values of s show temperature dependence unlike some previous results [4], where s remains constant over the whole temperature range.
|
Fig. 3. Temperature dependence of exponent s in temperature range of 202 – 220 K. |
Fig. 4. Exponent s as a function of glass composition for Br/(Br + I) for two various temperatures. |
Conclusions
We can now list the main ac characteristics of the phosphate conductive glasses which is follow from our measurements:
1) The real part of ac conductivity consists of two components, independent and strongly frequency dependent.
2)
At
high frequencies and low temperatures s(w) follows an apparent power low ![]() .
.
3) In a fixed frequency range s increases as temperature decreases (we can suppose that s®1.0for T®0).
4) S is between 0.5 – 0.7 in our investigated temperature range (in whole temperature region we suppose, that s is from interval (0 - 1)).
5) The additional deviation of ac conductivity from dc plateau to another constant value was observed indicating various hopping centers.
6) Ac conductivity is much less temperature dependent than the dc conductivity.
7) Exponent s is also a function of glass composition.
8) The parameter A and s(0)are Arrhenius temperature dependent.
Using these facts we can fit the frequency dependence of the electrical conductivity of ion conductive glasses for used frequency and temperature range by the following equation:
|
|
|
(2) |
where s0and A0 are the preexponential factors, kB is Boltzmann constant, and T is temperature.
Acknowledgement
The authors would like to thank Mr. F. Černobila for technical assistance. This work was partly financially supported by Grant No. 1/2016/05 of the Ministry of Education of the Slovak Republic.
References:
[1] H. Jain, S. Krishnaswani: Solid State Ionics, 105 (1998). 129
[2] A. Bunde, K. Funke and M. D. Ingram: Solid State Ionics 105, (1998) 1
[3] S. D. Baranovskii, H. Cordes: J. Chem. Phys. 111 (1999), 7546
[4] A. Pradel, G. Taillades, C. Cramer, and M. Ribes: Solid State Ionics 105 (1998), 139
[5] P. Znášik, M. Jamnický: Solid State Ionics 95 (1997), 207
[6] P. Bury, P. Hockicko, M. Jamnický, I. Jamnický: Advances in Electrical and Electronic Engineering, 2 (2003), No. 3-4, 16
[7] P. Bury, P. Hockicko, S. Jurečka, M. Jamnický: Phys. Stat. Sol. (c) 1 No. 11 (2004), 2888
[8] K. Funke, B. Roling, M. Lange: Solid State Ionics 105 (1998), 195
[9] K. Funke: Sol. State Ionics 94 (1997), 27
[10] P. Bury, P. Hockicko, I. Jamnický, M. Jamnický: Proc. Int. Congress on Acoustics ICA 2004, Kyoto 2004, II – 1137